python实验1
发布时间 :
字数:1k
阅读 :
项目一:分析销售数据
题目描述:
假设你是一家电子产品零售公司的数据分析师。公司提供了一份包含销售数据的CSV文件, 文件名为sales_data.csv。数据包括产品 ID、销售日期、销售数量、销售金额等信息。你的 任务是使用 Python 中的 NumPy、Pandas 和 Matplotlib 库进行数据分析和可视化,以回答
以下问题:
读取 sales_data1.csv 文件并将数据存储在一个 Pandas DataFrame 中。
计算每个产品的总销售数量和总销售金额。
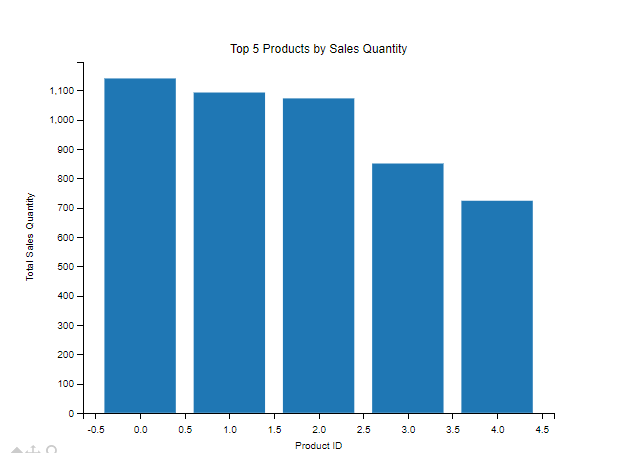
找出销售数量最高的前 5 个产品,并绘制它们的销售数量的条形图。
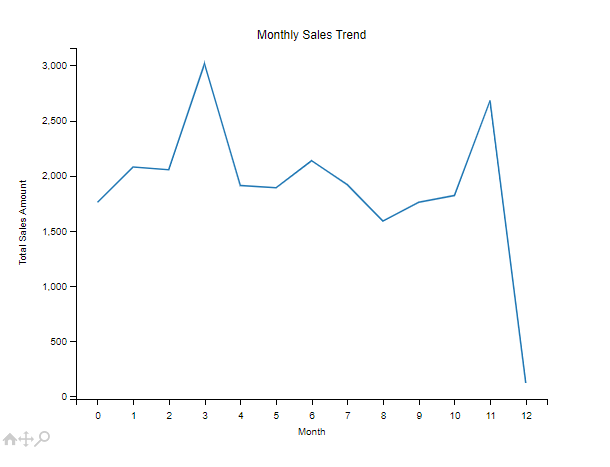
计算每个月的总销售金额,并绘制一个折线图展示月度销售趋势。
分析:
使用numpy,pandas对数据进行处理,然后使用matplotlib进行绘图,实现数据可视化
实现代码:
1
2
3
4
5
6
7
8
9
10
11
12
13
14
15
16
17
18
19
20
21
22
23
24
25
| import pandas as pd
import numpy as np
import matplotlib.pyplot as plt
df =pd.read_csv('sales_data1.csv')
product_sales = df.groupby('ProductID').agg({'Quantity': 'sum', 'Amount': 'sum'}).reset_index()
top_products = product_sales.nlargest(5, 'Quantity')
plt.bar(top_products['ProductID'], top_products['Quantity'])
plt.xlabel('Product ID')
plt.ylabel('Total Sales Quantity')
plt.title('Top 5 Products by Sales Quantity')
plt.show()
df['SalesMonth'] = pd.to_datetime(df['SalesDate']).dt.to_period('M')
monthly_sales = df.groupby('SalesMonth')['Amount'].sum().reset_index()
plt.plot(monthly_sales.index,monthly_sales['Amount'])
plt.xlabel('Month')
plt.ylabel('Total Sales Amount')
plt.title('Monthly Sales Trend')
plt.show()
|
执行结果:
销售数量条形图:
月度销售趋势
项目一:分析销售数据(进阶版)
项目目标:
项目步骤:
数据准备: - 提供了一个虚拟的销售数据的 csv 文件。
数据加载与清理: - 使用 Pandas 加载 CSV 文件。 - 清理数据,处理缺失值、异常值等。
基本统计分析: - 使用 Numpy 和 Pandas 进行基本的统计分析,如总销售额、平均销售数量等。
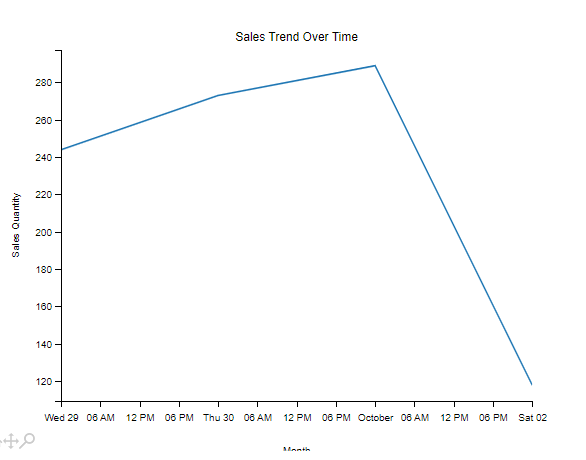
销售趋势分析: - 利用 Matplotlib 绘制销售趋势图,展示销售随时间的变化。
产品分析: - 利用 Pandas 和 Numpy 找出最畅销的产品,最畅销的地区等。 - 利用 Matplotlib 绘制产品销售排行榜。
地区分析: - 使用 Matplotlib 绘制销售地区的分布图,了解销售的地域差异。
高级统计分析(可选): - 利用 Scipy 进行更高级的统计分析,如假设检验、回归分析等。
代码:
1
2
3
4
5
6
7
8
9
10
11
12
13
14
15
16
17
18
19
20
21
22
23
24
25
26
27
28
29
30
31
32
33
34
35
36
37
38
39
| import pandas as pd
import numpy as np
import matplotlib.pyplot as plt
df=pd.read_csv('sales_data2.csv')
df.dropna(inplace=True)
total_sales = df['SalesQuantity'] * df['SalesPrice']
average_sales_quantity = df['SalesQuantity'].mean()
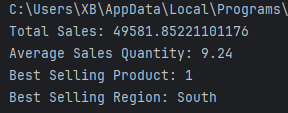
print(f'Total Sales: {total_sales.sum()}')
print(f'Average Sales Quantity: {average_sales_quantity}')
df['SalesDate'] = pd.to_datetime(df['SalesDate'])
df.set_index('SalesDate', inplace=True)
df.resample('M').sum()['SalesQuantity'].plot()
plt.title('Sales Trend Over Time')
plt.xlabel('Month')
plt.ylabel('Sales Quantity')
plt.show()
best_selling_product = df.groupby('ProductID')['SalesQuantity'].sum().idxmax()
print(f'Best Selling Product: {best_selling_product}')
best_selling_Region=df.groupby('Region')['SalesQuantity'].sum().idxmax()
print(f'Best Selling Region: {best_selling_Region}')
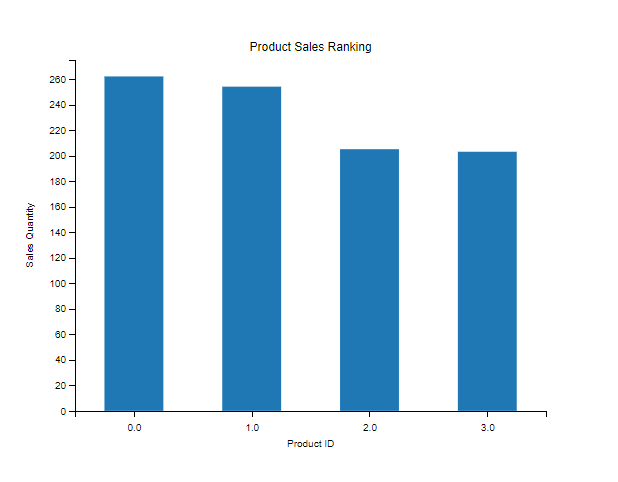
product_ranking =df.groupby('ProductID')['SalesQuantity'].sum().sort_values(ascending=False)
product_ranking.plot(kind='bar', rot=0)
plt.title('Product Sales Ranking')
plt.xlabel('Product ID')
plt.ylabel('Sales Quantity')
plt.show()
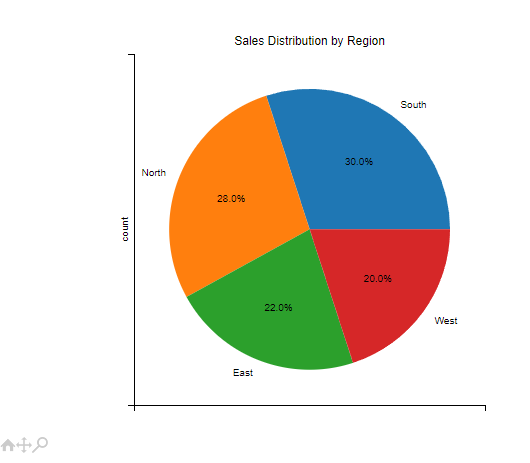
region_distribution = df['Region'].value_counts()
region_distribution.plot(kind='pie', autopct='%1.1f%%')
plt.title('Sales Distribution by Region')
plt.show()
|
输出:
总销售额、平均销售数量,最畅销的产品,最畅销的地区
销售趋势分析:
产品销量排行榜:
销售地区分布图:
转载请注明来源,欢迎对文章中的引用来源进行考证,欢迎指出任何有错误或不够清晰的表达。可以在下面评论区评论


